
Astrophysics
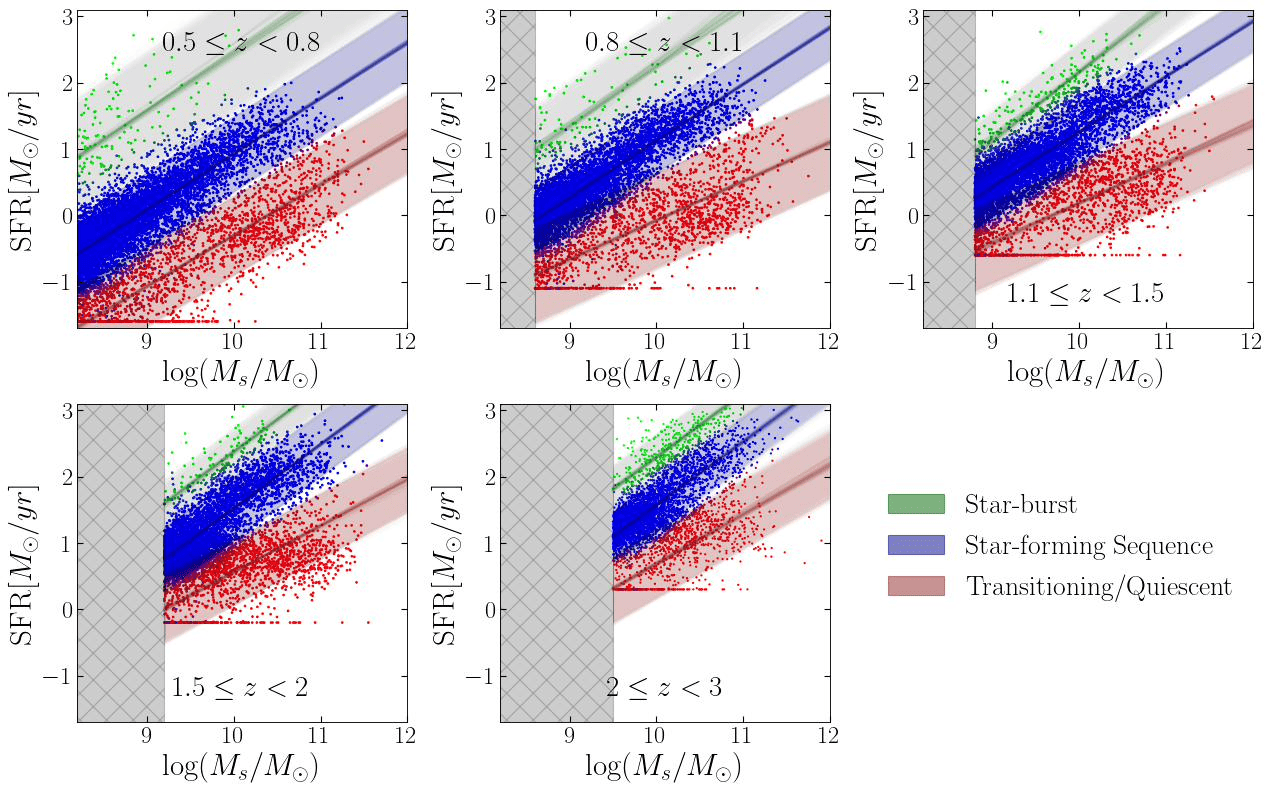
Star-forming main sequence
SFR vs. stellar mass in bins of redshift, with points colored by their posterior probability of being star-forming, star-burst, or quiescent — the three-component mixture the model fits jointly.
Good statistical work is only half the job — the other half is making the model and the data legible. These are figures from my research, my industry work, and the machine-learning course I taught.
The spectral energy distribution, star-formation history, main-sequence position, and rest-frame & observed colours of a massive galaxy as it forms its stars and quenches — the dynamic companion to the colour–colour selection below.
SFR vs. stellar mass in bins of redshift, with points colored by their posterior probability of being star-forming, star-burst, or quiescent — the three-component mixture the model fits jointly.
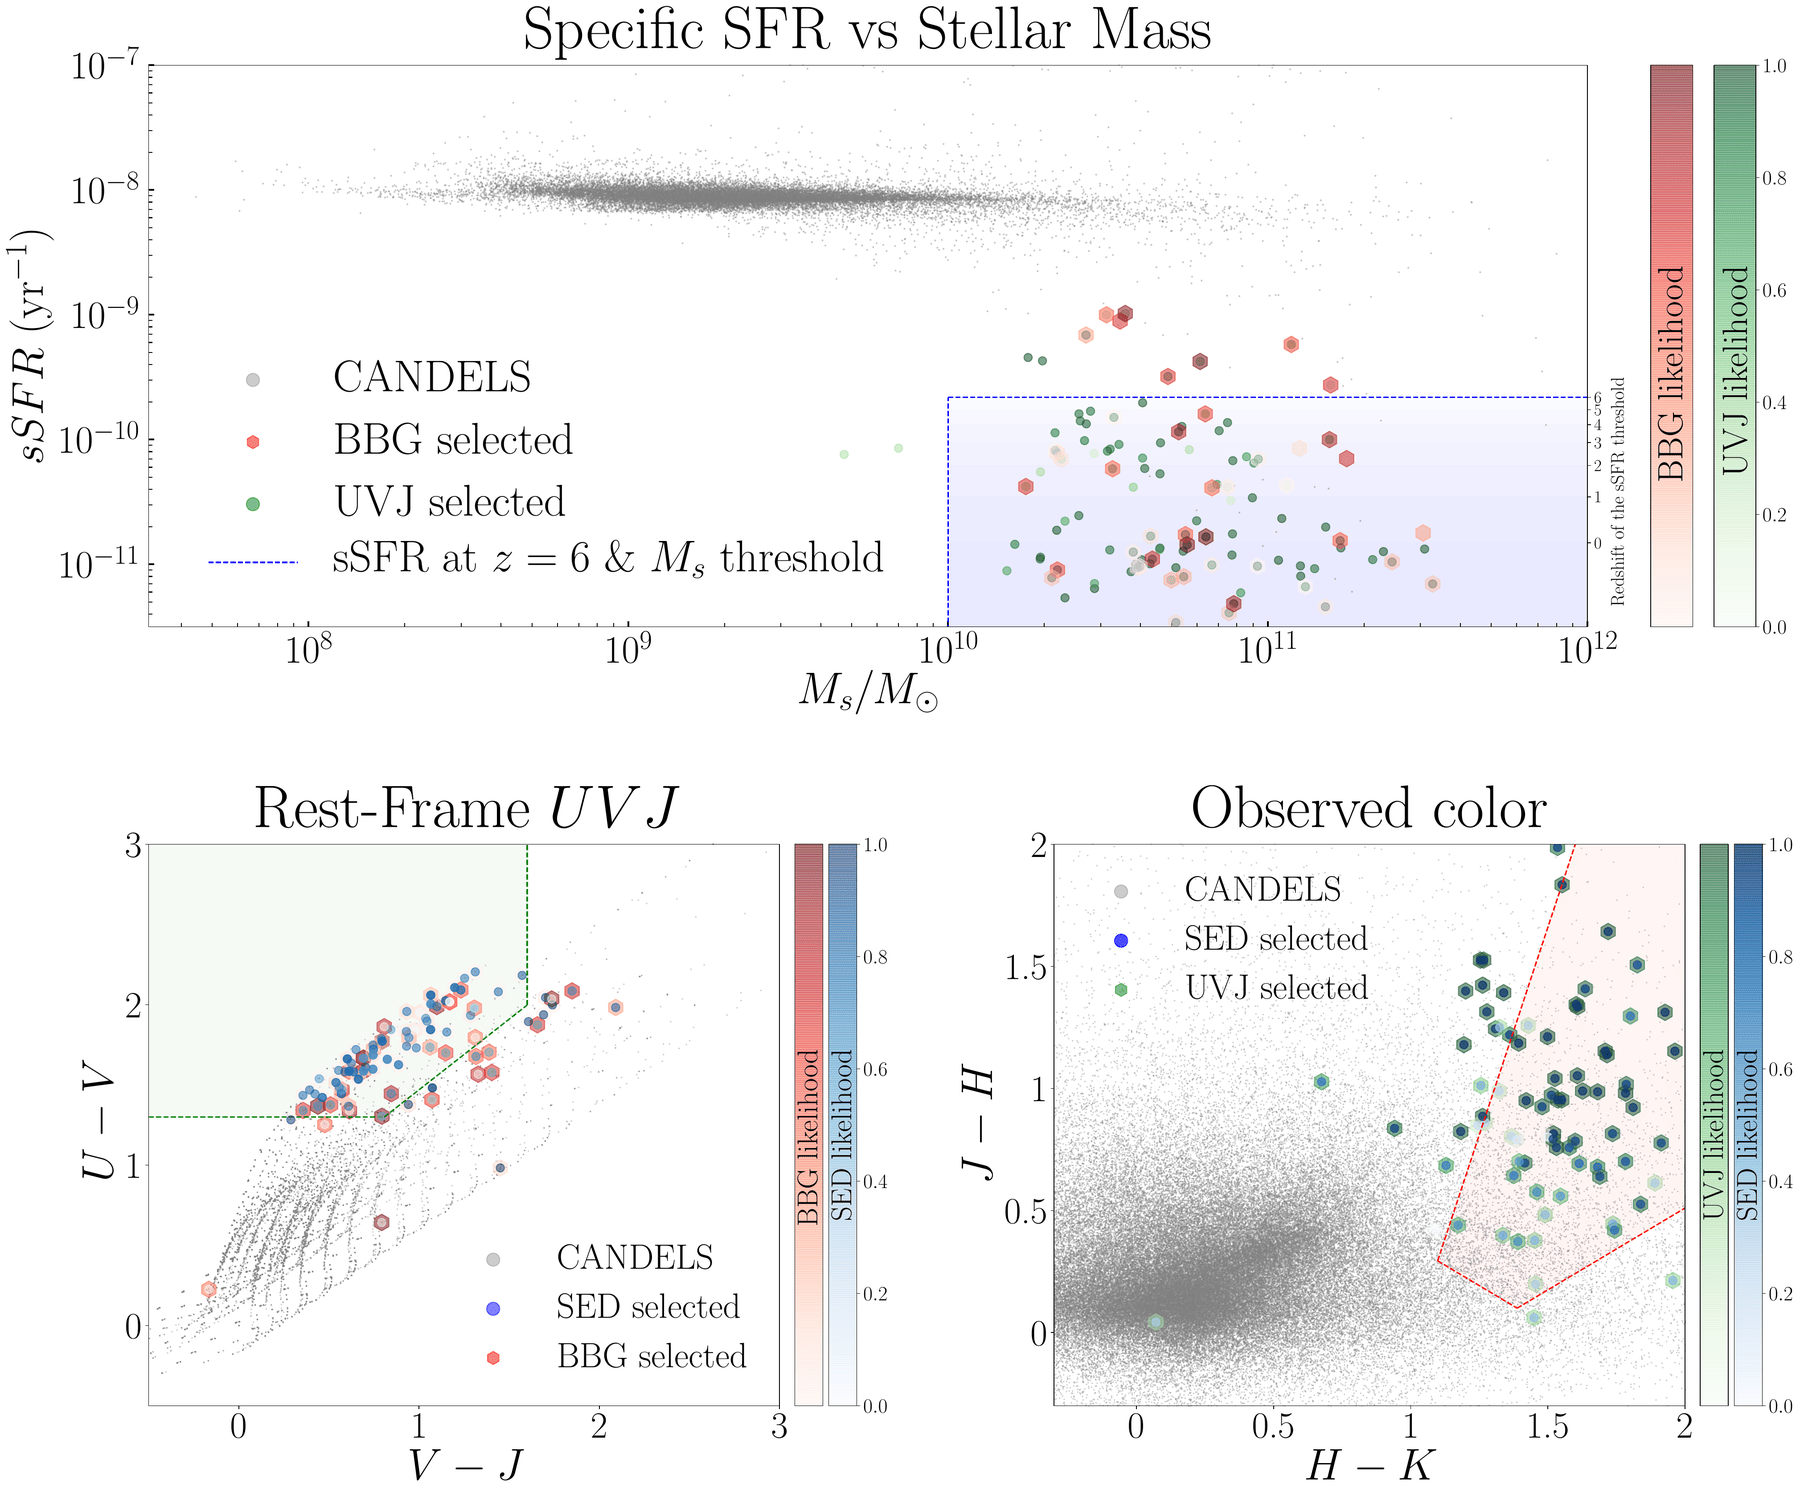
Specific SFR and rest-frame colors used to isolate massive, evolved galaxies at 3 ≤ z ≤ 4.5, with candidates shaded by the likelihood each selection method assigns.
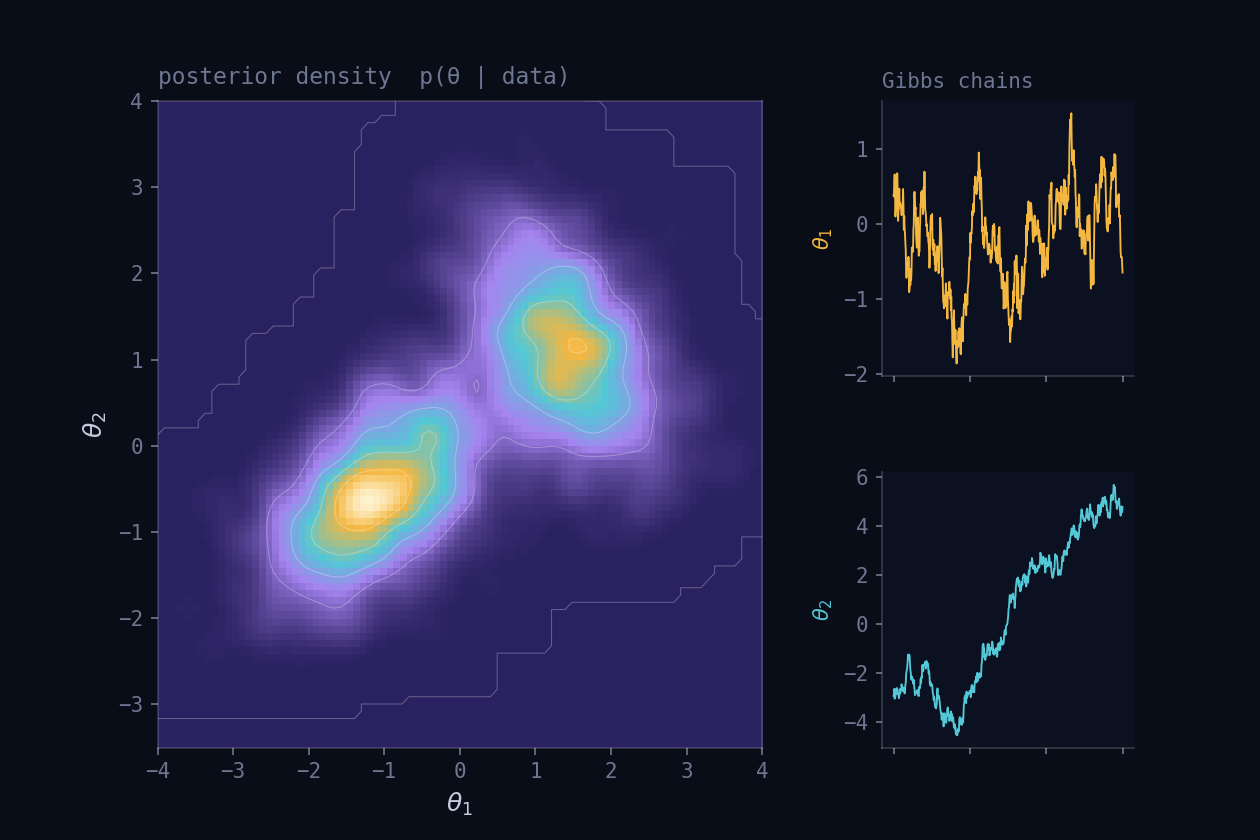
A bimodal posterior density estimated non-parametrically, with the Gibbs chains that explored it — the engine behind the demographic-imputation work.
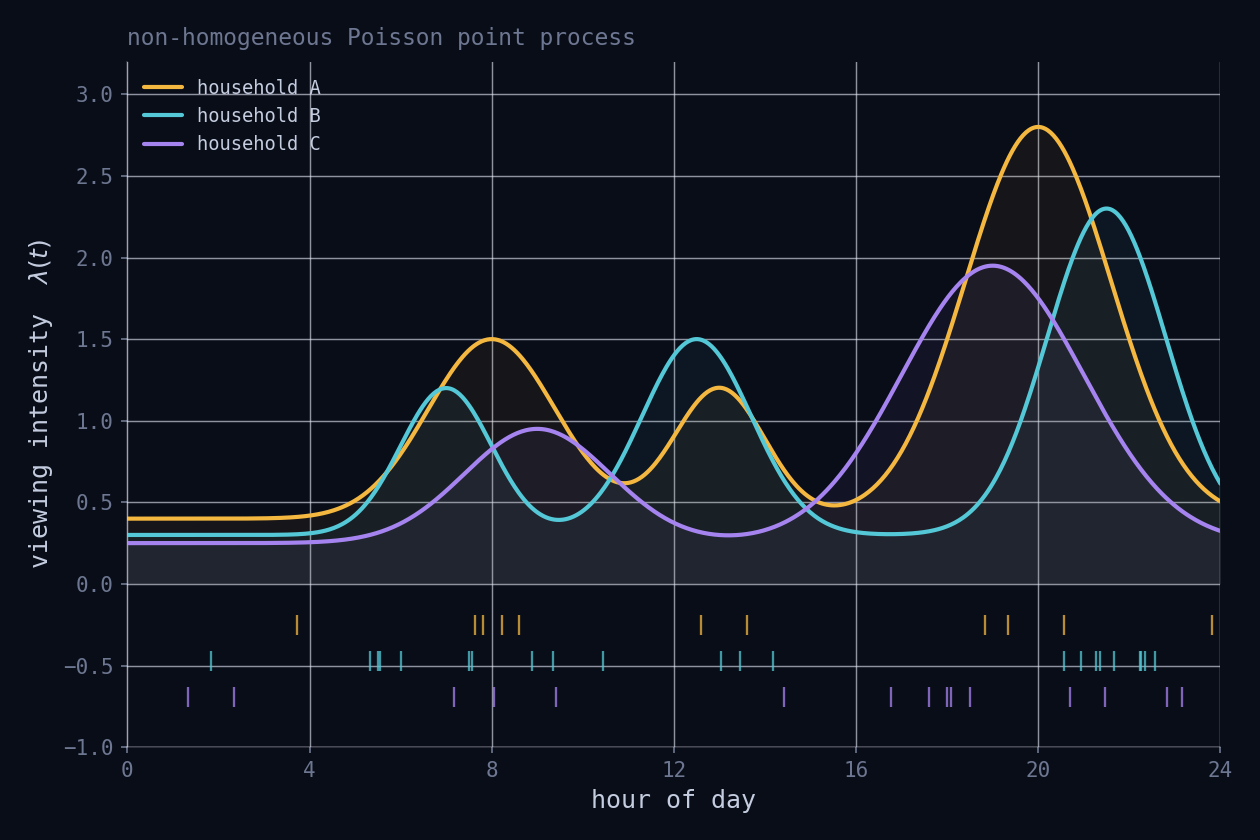
Time-varying viewing intensity for several households, with the underlying event ticks. This is how purchase, digital activity, and TV-viewership behavior gets modeled.
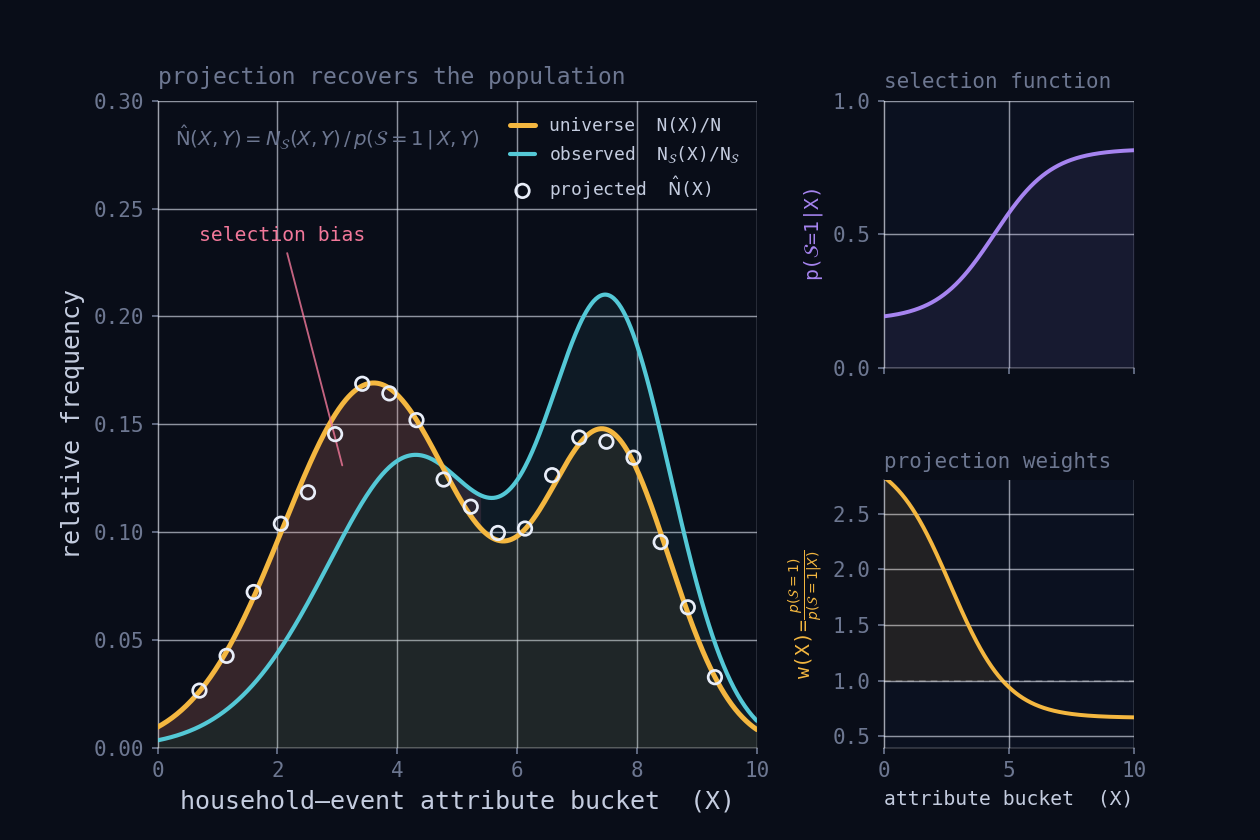
A method for estimating the attribution and effect of advertising as treatment on an outcome (e.g. purchases records) using survey data. Built a projection framework for unbiased measurement of household–event pairs under incomplete observation.
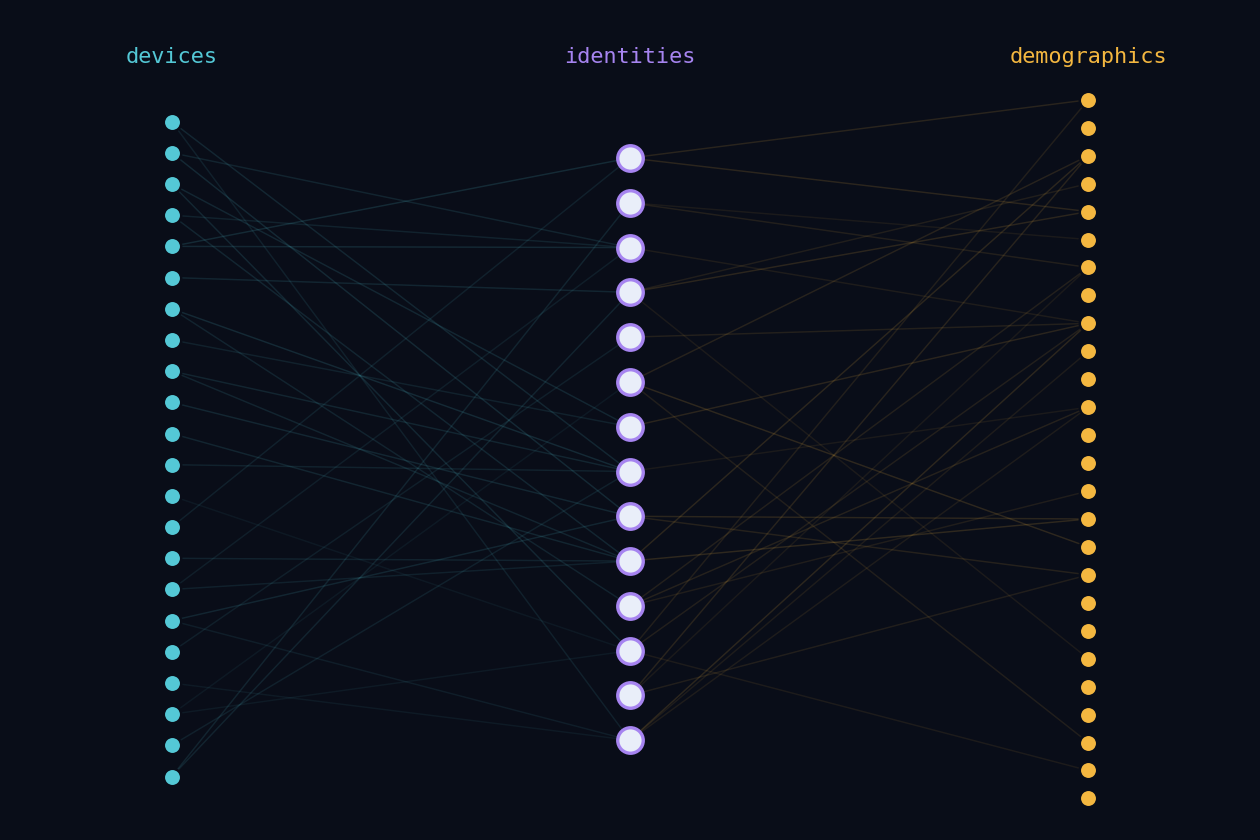
Devices, resolved identities, and demographics as an evolving bipartite graph — the structure behind large-scale identity resolution.
Stellar mass functions, quenching efficiency, and the quiescent-probability surfaces from the hierarchical Bayesian model are shown in context there — and dozens more worked plots live in the course notebooks.