
High-redshift galaxies,
read statistically.
My research is observational extragalactic astrophysics with a statistical core: extracting the physical properties of galaxies in the early universe from multiwavelength photometric catalogs — the kind with noise, selection effects, censored measurements, and missing bands — using probabilistic models that carry that uncertainty end to end.
Statistical study of the galaxy populations at high redshift from multiwavelength catalogs
Ph.D. in Physics & Astronomy · University of California, Riverside · 2017–2021
Modeling the quiescent fraction, jointly.
I built a single probabilistic model for the star-forming sequence that fits three galaxy types at once — star-forming, star-burst, and transitioning/quiescent — as a mixture on the SFR–mass plane, and simultaneously infers the probability that a galaxy is quiescent as a function of its stellar mass and local environment. Stellar-mass and SFR uncertainties, censored SFRs, and the stellar mass function are all modeled together, with inference in Stan by Hamiltonian Monte Carlo.
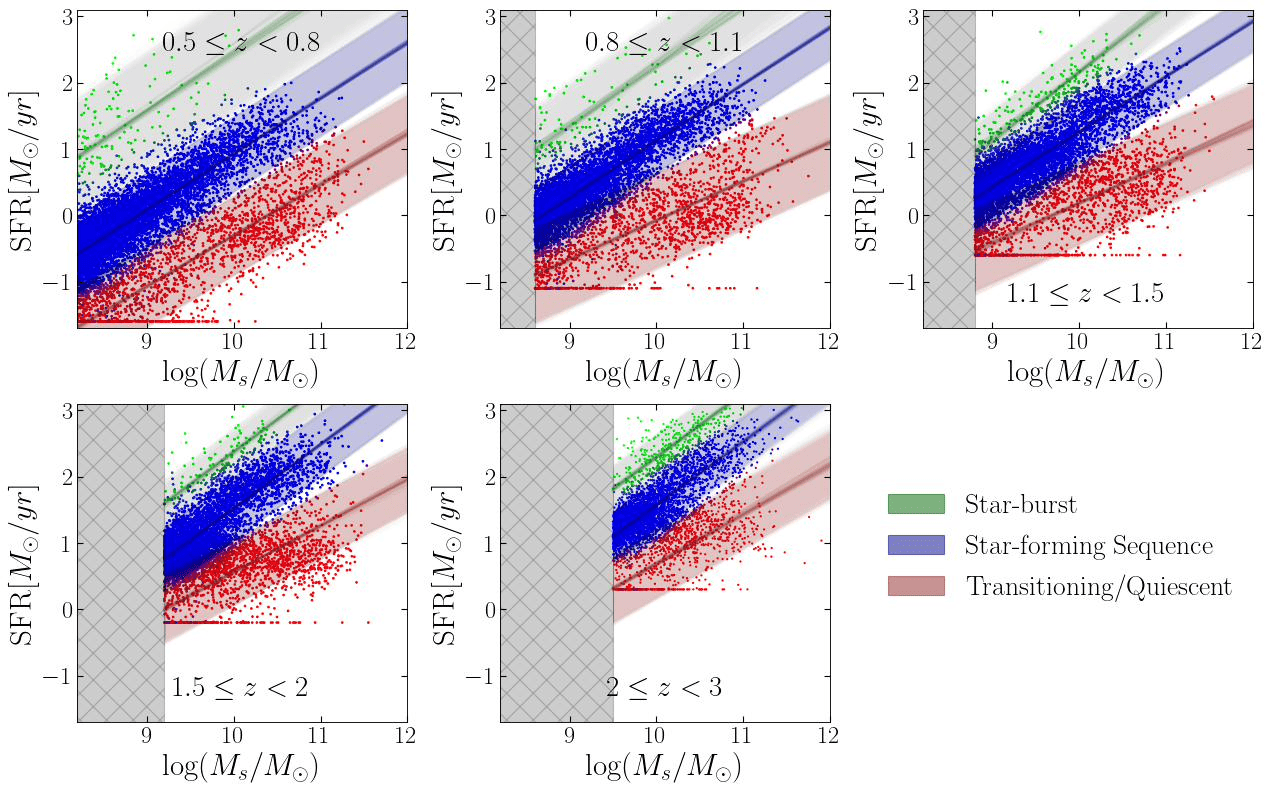
Star-forming sequence over cosmic time
SFR vs. stellar mass in five redshift bins. Points are colored by their posterior probability of belonging to each component — quiescent (red), star-burst (green), star-forming (blue); lines and bands are posterior draws of the mean relation and its 2σ intrinsic scatter. The hatched region marks the mass-completeness limit.
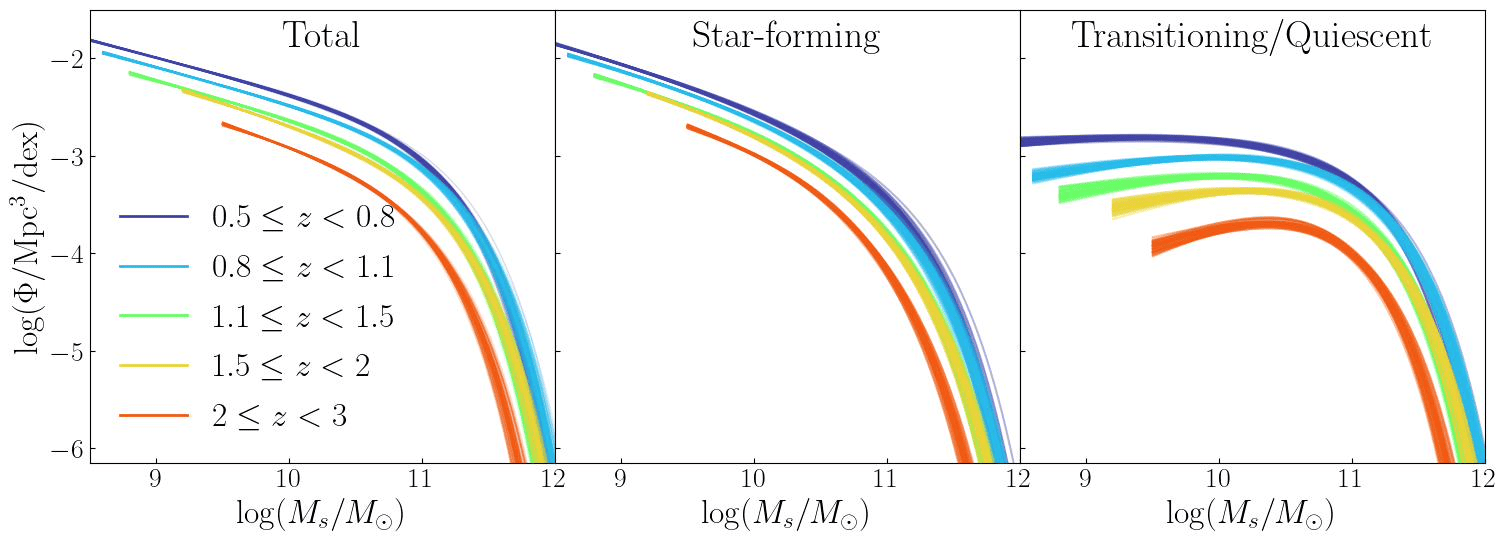
Stellar mass functions
Total, star-forming, and transitioning/quiescent stellar mass functions by redshift, obtained by weighting the inferred mass distribution by galaxy-type probability and integrating over environment. The quiescent population builds up rapidly toward lower z.
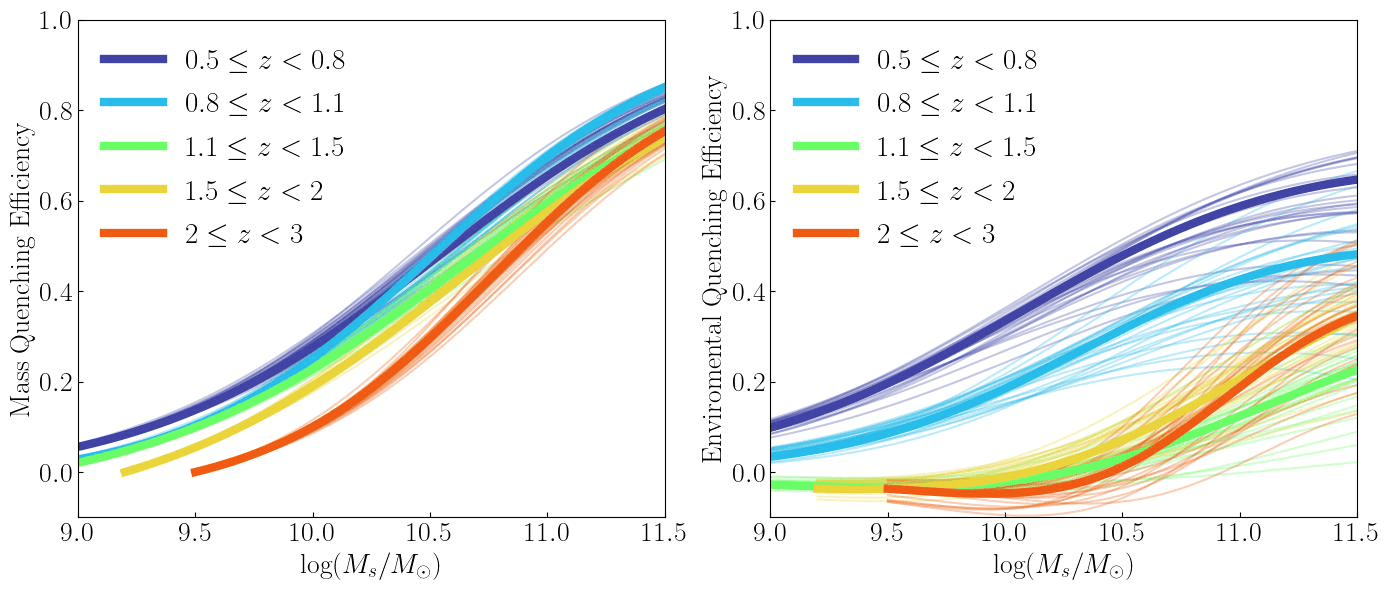
Mass & environmental quenching efficiency
Environmental quenching efficiency rises with redshift at lower masses and increases with stellar mass — the imprint expected if the most massive galaxies deplete their gas fastest (the “overconsumption” picture).
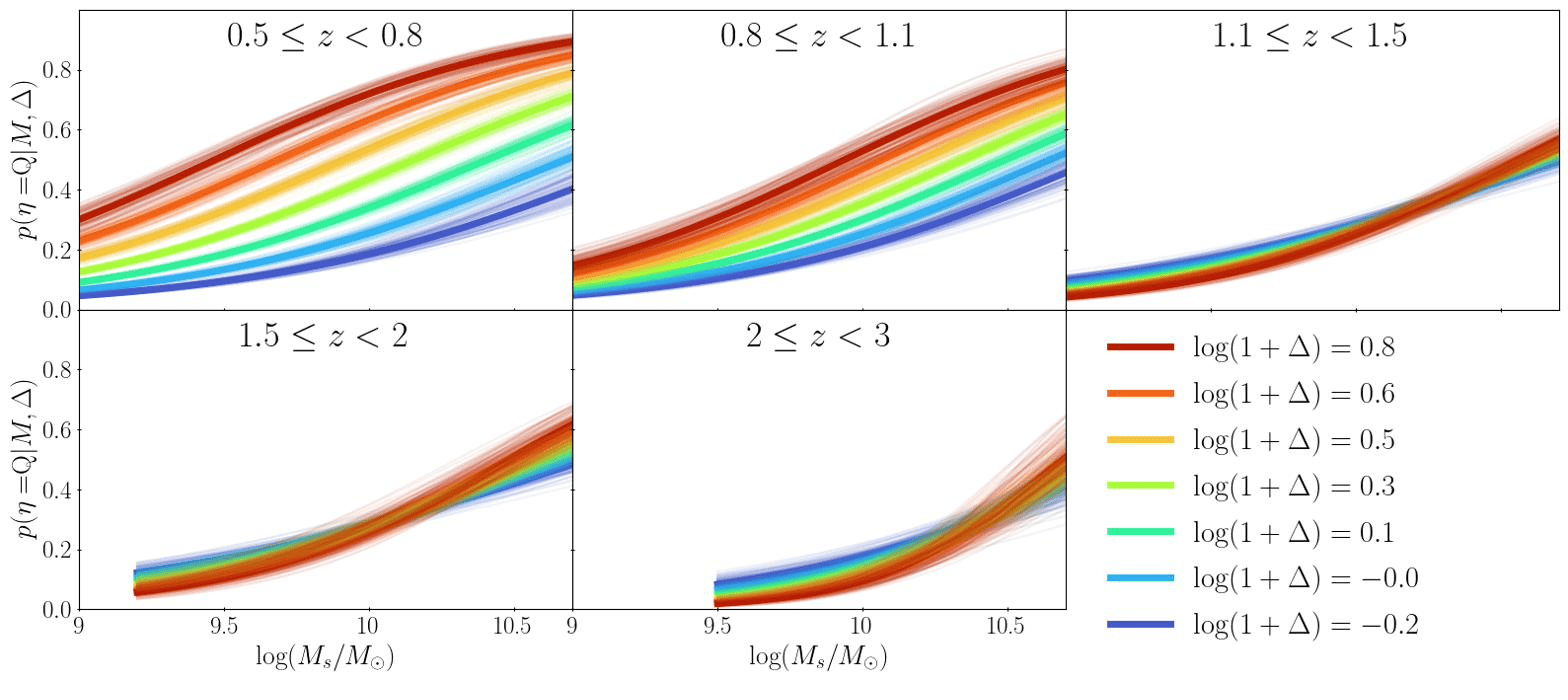
Quiescent probability vs. stellar mass
In panels of redshift, colored by local density contrast. The probability of being transitioning/quiescent increases with stellar mass at every environment and epoch.
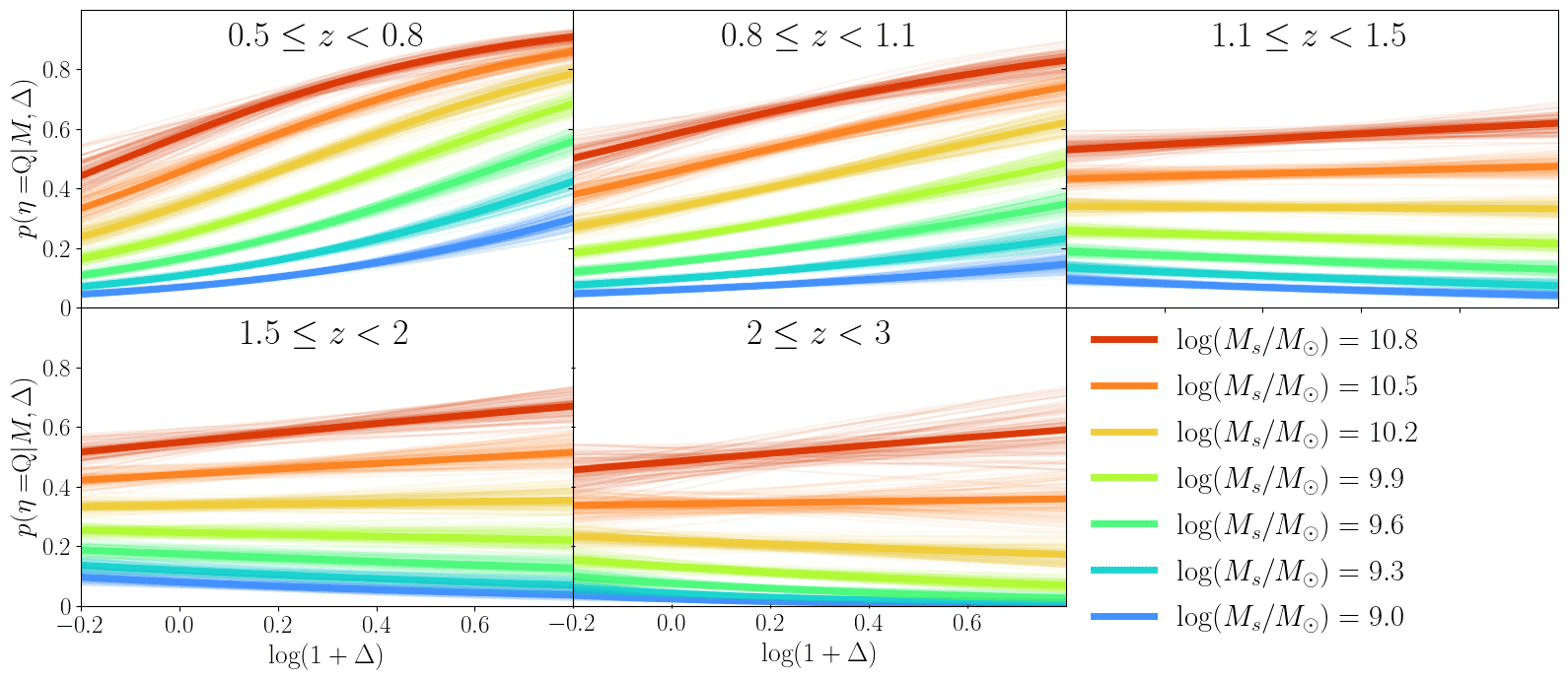
Quiescent probability vs. environment
The same probability against local density contrast, colored by stellar mass. Above ~1010.5 M☉ denser regions raise the quiescent fraction out to z ~ 3; at low mass the trend reverses around z ~ 1–1.5.
- Mass drives quiescence everywhere. The quiescent fraction rises with stellar mass at every environment and redshift probed.
- Environment matters most for massive galaxies. Above ~1010.5 M☉, denser environments raise the chance of being quiescent out to z ~ 3; at lower masses the effect reverses around z ~ 1–1.5.
- Mass and environment interact at early times. Above z ~ 1.2 their interaction becomes important — the effect of environment grows with stellar mass.
- Consistent with overconsumption. Environmental quenching efficiency increases with both redshift and stellar mass, as expected if the most massive galaxies deplete their gas fastest.
Finding massive evolved galaxies at 3 ≤ z ≤ 4.5.
My first-author work builds a complete, statistically characterized sample of massive, already-evolved galaxies in the early universe — rare objects that can easily be confused with dusty star-forming galaxies. It combines color-selection methods, using both rest-frame and observed-frame colors, with Bayesian SED fitting across the full multiwavelength catalog, assigning each candidate a likelihood rather than a hard yes/no classification. In a follow-up project, I demonstrate how machine-learning and manifold-learning techniques can make the selection more robust, using semi-analytic model simulated catalogs for training, testing, and validation. These simulations are designed to mimic real observations both physically and statistically, including measurement uncertainties and missing data.
How a massive galaxy becomes selectable
A massive galaxy evolved forward in cosmic time. The main panel is its full spectral energy distribution with the survey's filter bandpasses; the insets track its star-formation history, its place on the star-forming main sequence, and its path across the rest-frame (UVJ) and observed (at z = 3) colour–colour planes. As it forms its stars and quenches it migrates into the region where these selections isolate massive quiescent galaxies at high redshift.
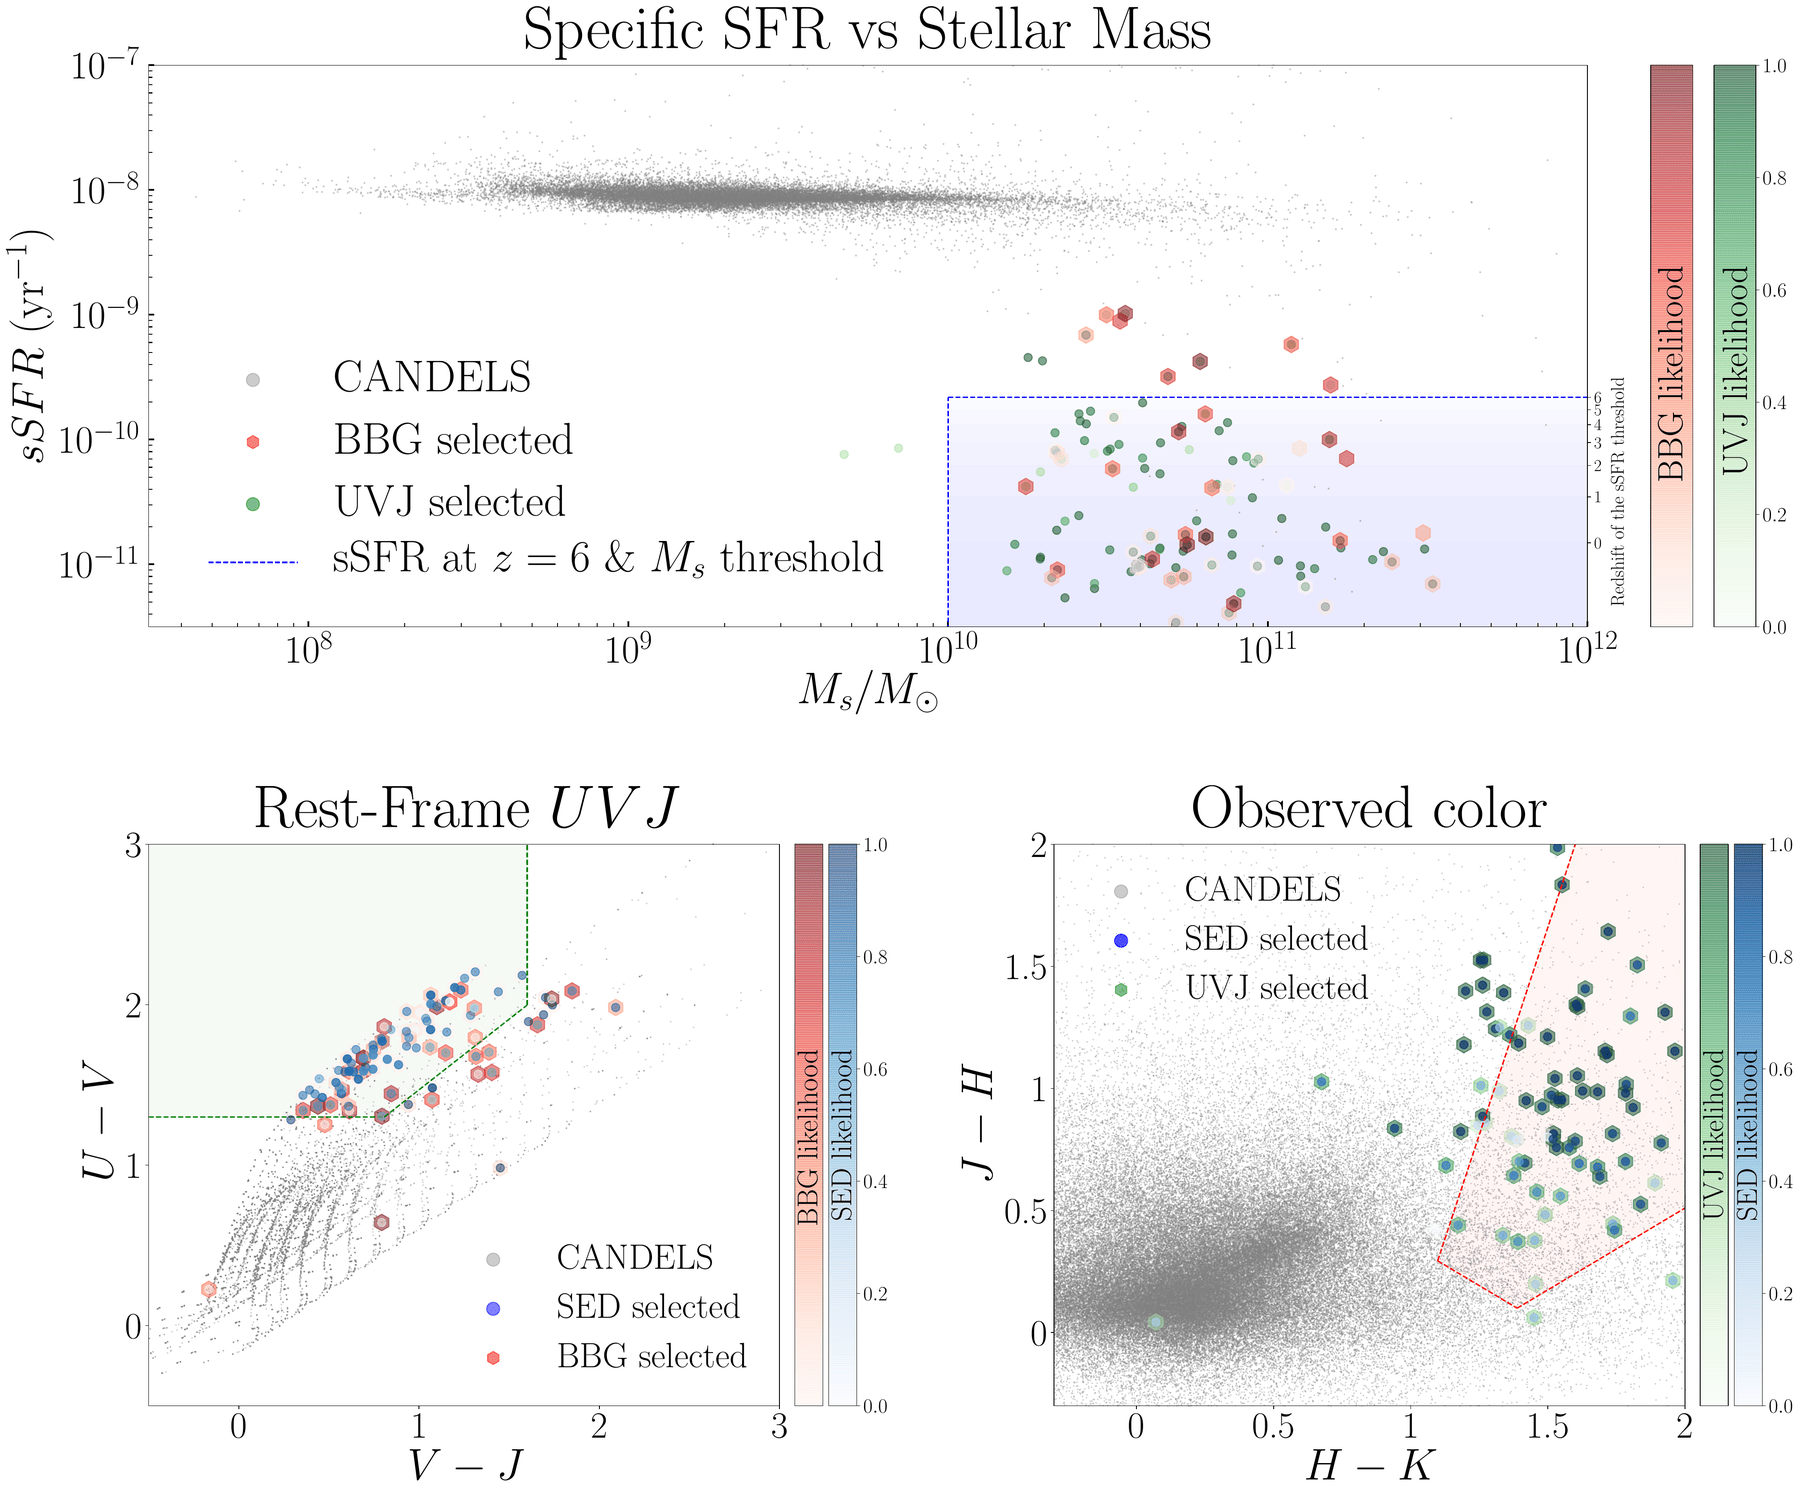
Selecting in sSFR & color space
Specific SFR vs. stellar mass with the z = 6 threshold (top), and rest-frame UVJ and observed near-infrared colors (bottom). Points are shaded by the likelihood each method — Balmer-break, UVJ, and SED — assigns to a candidate.
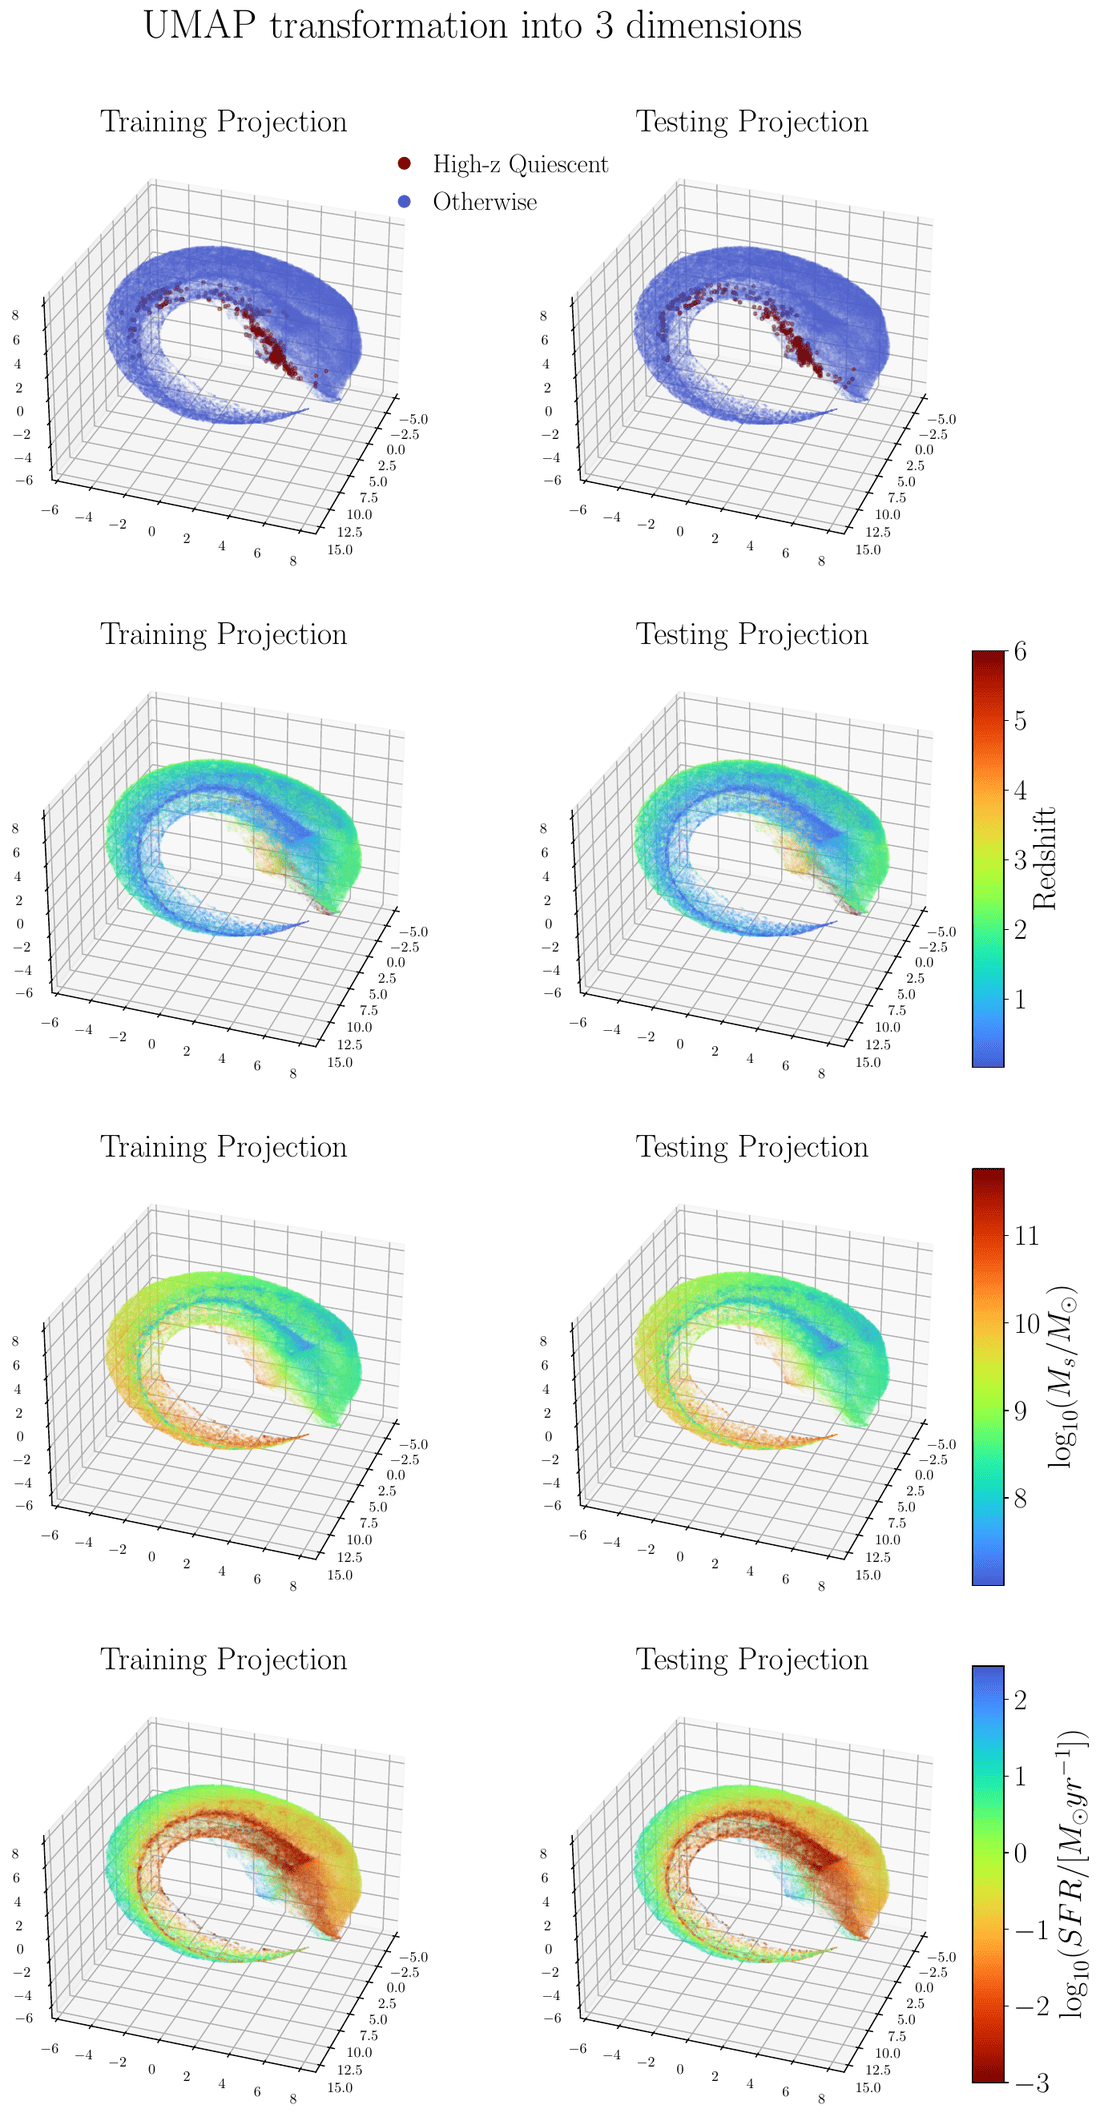
A 3D color-space embedding
UMAP projects the high-dimensional color catalog into three dimensions. High-z quiescent galaxies separate cleanly from the rest of the manifold, which also organizes smoothly by redshift, stellar mass, and SFR — in both training and held-out testing projections.
The statistical toolkit.
Mixture models
Three galaxy types modeled jointly on the SFR–mass plane, with a logit link for the quiescent fraction in stellar mass, density, and their interaction — over samples reaching ~1M galaxies.
Latent-variable likelihood
Measurement errors, left-censored (lower-limit) SFRs, and a Schechter stellar mass function are built into one likelihood and marginalized consistently, inferred with Stan / HMC.
Reducing color space
UMAP, t-SNE and supervised PCA bring dimensionality reduction to SED fitting — compressing many photometric bands into a space where galaxy types separate.
Data & surveys
COSMOS2020 — multi-wavelength catalog for 1.7 million celestial sources across the Cosmic Evolution Survey field.
Photometric redshifts — Kodra et al. combined PDFs
SFRs — UV+IR calibration (Barro et al.)
Physical properties — SED fitting (BAGPIPES)
Stellar masses — SED fitting (LePhare, BC03)
Local density — weighted KDE fields (Chartab et al.)
Santa Cruz SAM — semi-analytic color catalogs
Observing experience
2016 Observational Astronomy Workshop, Lick Observatory, Mt. Hamilton, California